The Physics of an F3J Launch by Dennis L Harvey
This article first appeared in the January 2021 issue of Model Aviation, the official publication of the Academy of Model Aeronautics and is reprinted here with permission. This is the longer version of the article which appeared online with a section that included extra detail and graphs.
I had been an avid RC sailplane flier during the 1970s but because of my engineering career, I took a very long break. I returned to the sport in 2017 when I moved from the Midwest to central Florida. I was wowed by the innovations over those 35 years; from the competitiveness of full house controls, to miniaturization of electronics, to the extensive use of carbon fiber.
But when I saw my first F3J event, I was particularly fascinated with the launches. They seemed truly brutal. For one, the F3J winch line is much more elastic than the standard twine thermal duration winch lines I used in the past. The dynamics were clearly different. If you haven’t seen an F3J launch, look it up on YouTube.
In an F3J launch, the goal is to get as much altitude as you need (often up to 250 meters) while staying on the winch line as short a time as possible (usually less than 5 seconds). Every second you are on the winch line is a point you can’t make up during the flight or with landing points. As an engineer, I wanted to understand what was happening physically during launch. As I befriended some of the best pilots in my area and did some digging, I was surprised to find there is little accessible research on the topic. It didn’t take much arm twisting to put together a top notch team to take a more scientific look at the subject.
The Team
For this experiment, we had some of the best fliers participate by piloting instrumented sailplanes. Three team members have been part of Team Soaring USA, representing the United States on the international F3J circuit. Jody Miller took second place at the last international competition in 2018. Jeff Duval is currently the number one USA pilot for the next competition (which was postponed this year because of the pandemic). Gordon Buckland has been on the team numerous times and is a quintessential organizer for the sport. Ed Dumas, who drove down from Tennessee for our January 2020 flight weekend, provided invaluable expertise on flying and instrumentation. Though I didn’t have the flying credentials of the others, I was quite at home with experimental design as it was often part of my career.
The Approach
At the core of the experimental design
was to measure the sailplane’s energy state as it progressed through the
launch. The total energy of the
sailplane is the sum of its potential energy (proportional to altitude) and its
kinetic energy (proportional to speed squared).
Additionally, we wanted to video record the launch from onboard in order
to determine the wing load (based on wing flex) and the angle of the winch line
and the horizon. Where ever possible, we
tried to confirm our findings through a secondary measurement or calculation.
A Representative Launch Example
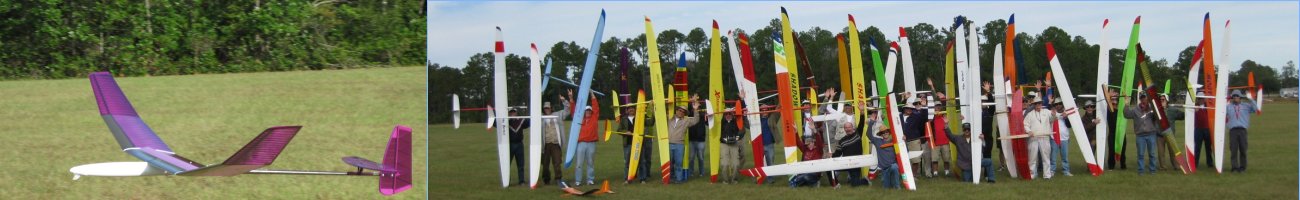
To keep this article simple, I will show only one of 26 launches. The launch is representative of a high performance F3J launch. Jody Miller was the pilot flying a carbon fiber 3.8 meter wing span Xplorer3 F3J model. This is a very common sailplane at F3J events. The temperature was around 80° F, our ground level was approximately 60 feet ASL, and the winds were less than 4 mph. Jody’s launch attained an altitude of 251 meters with his total time on the winch line of 4.8 seconds. Flaps were initially set at 15 mm down (12 degrees) until the “Bucket” phase when they were set 3 mm up for speed. The winch was a standard competition winch with1.32 mm diameter winch line.
The Instrumentation
The key to getting a potential energy determination was to have an accurate altimeter. Onboard the sailplane, Ed offered up a Hexpert altimeter which could easily record every tenth of a second. For kinetic energy, we used a FrSky airspeed sensor. Unfortunately, its data sampling rate was no better than 0.2 seconds. As a result, when graphed every tenth of a second, the data has a “saw tooth” look to it compared to the Hexpert data. Still, the data was accurate enough to give us insight and could be corroborated by other collected information.
These instruments were mounted externally to the plane as pods shown in Figure 1. The instruments were controlled by a separate receiver so that someone other than the pilot could operate a second transmitter for telemetry, data acquisition. All the pilot had to do was fly the launch.
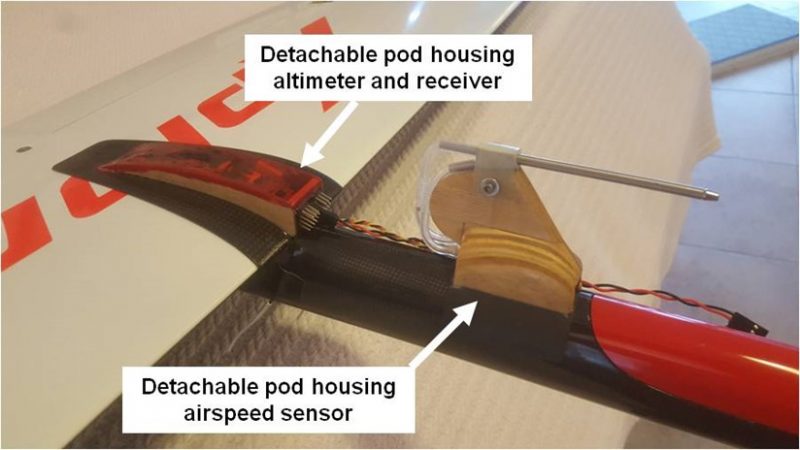
Figure 1. Detachable instrumentation pods.
Another critical instrument was the onboard video. We chose a camera that is typically used in small drones. Figure 2 shows a Caddx Tarsier installation that is mounted on a carbon fiber blade and sandwiched between the wing panels. The camera looks towards the fuselage to monitor angle of the horizon, angle of the winch line, and wing flex under load. Data was recorded on an SD card which was removed and downloaded every several flights. The video was analyzed one frame at a time and measurements were made on a large screen monitor. Here is a short video of a launch:
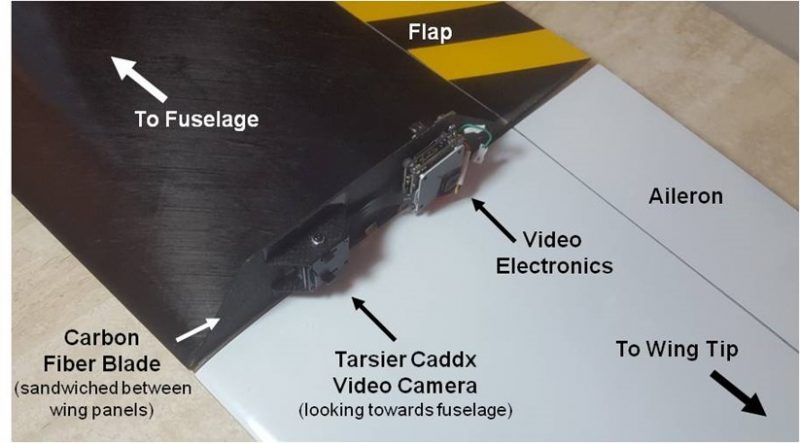
Figure 2. Under side of the right wing
showing the video camera and electronics attached to a carbon fiber blade
sandwiched between the wing panels.
Flight Path of a F3J Launch
Figure 3 shows the distinctly different phases of the launch. Let’s go through each point on the path. We’ll stick with Jody’s launch as the example.
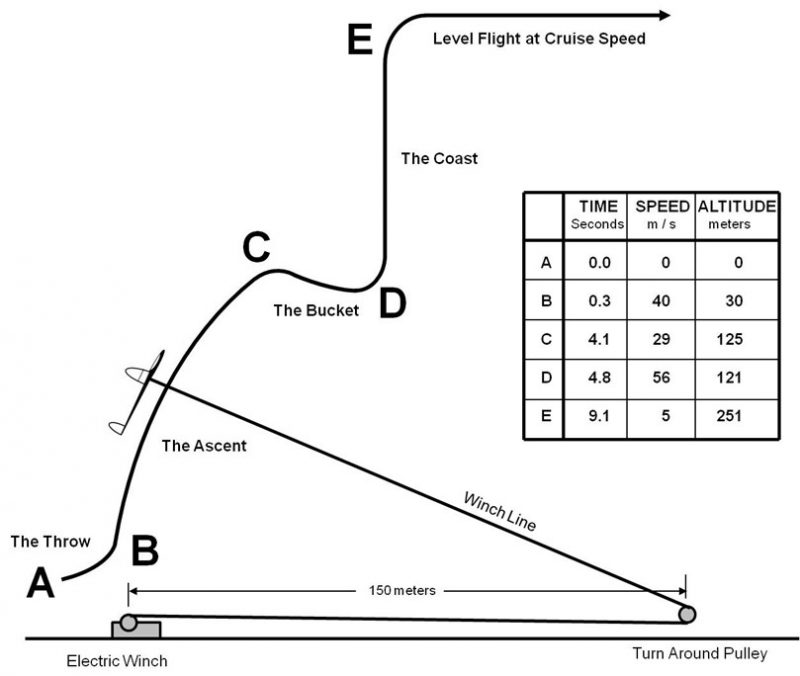
Figure 3. The flight path during an F3J launch
Point A. Figure 4 shows Gordon Buckland at the ready to throw the sailplane. He consistently threw the plane at 35 degrees to the horizon (as viewed by a ground based video camera aimed at the launch point). It is estimated that Gordon restrained the plane against 600 Newtons of force (135 pounds-force) prior to the throw. This estimate is based on force measurements at the turn around pulley with a digital force meter.

Figure 4. Gordon Buckland prepared to throw the sailplane at time equals zero.
Point B. After the throw, the sailplane establishes itself in an equilibrium state to begin the Ascent phase of the launch. Point B happened at time equals 0.3 seconds with a speed of 40 meters per second (89 mph). That represents a g-force acceleration of about 13.5. The speed quickly backed down to around 29 meters per second (65 mph) and remained constant till Point C. The plane began the Ascent angled upwards at 71 degrees to the horizon. Since the sailplane maintained a constant speed, you would expect to see the winch line nearly perpendicular to the sailplane and this can be seen in Figure 5.
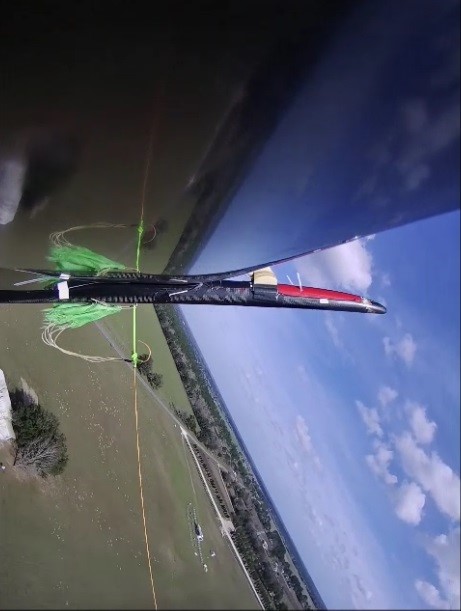
Figure 5. This frame grab from the video soon after Point B during the Ascent phase. The winch line is nearly perpendicular to the axis of the sailplane.
Point C. This is the point of the flight path where the pilot begins to extract remaining energy from the winch line to catapult the sailplane forward and achieving the highest speed during the launch. This begins the phase known as the “Bucket”. To begin this phase, the pilot retracts the flaps and sets them to the speed mode (usually 3 mm up) and pushes the nose forward. In Jody’s flight, Point C happened at time equals 4.1 seconds. At this point, he was at an altitude of 125 meters, a speed of 29 meters per second (65 mph), and the winch line was approximately 45 degrees to the horizon.
Point D. At this point, the pilot decides to end the energy extraction of the Bucket phase. In Jody’s flight, he was in the Bucket for only 0.7 seconds. However, during that time, the sailplane doubled its speed, disengaging from the winch line at a speed of 56 meters per second (125 mph). Point D happened at time 4.8 seconds. During a contest, this is when the timer would begin the stopwatch for the flight.
Point E. From Point D to Point E, the pilot is coasting up to a peak altitude since the sailplane is now disengaged from its energy source, the winch line. The optimal trajectory is to coast up nearly vertical. When the plane has slowed to near cruise speed, the nose is pushed forward and the plane is leveled off. In Jody’s flight, this happened at time equals 9.1 seconds.
The Energy State Graph
The prize of the experimentation was the creation of the energy state graph shown in Figure 6.
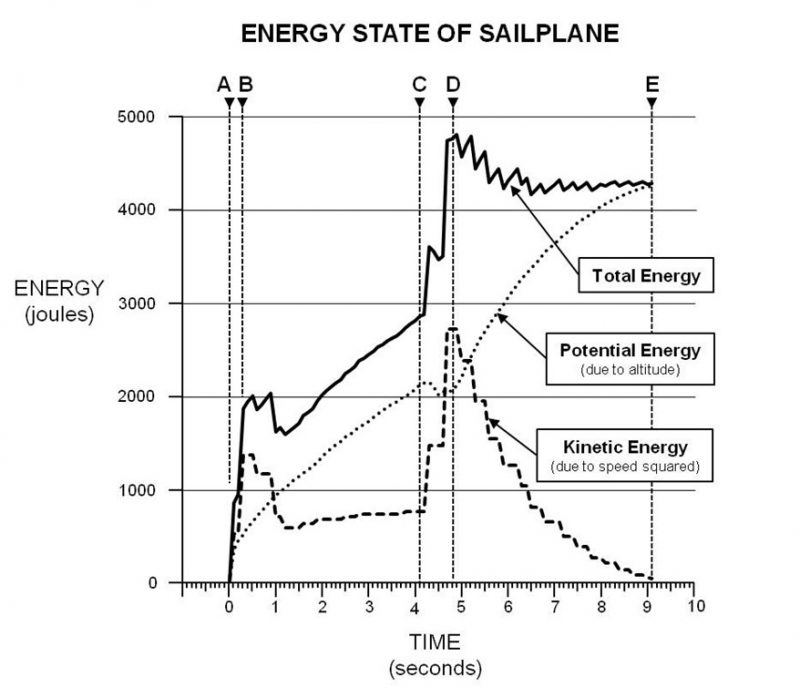
Figure 6. Energy State of the Sailplane.
There are several interesting points to note on the graph. These points were consistent for numerous flights.
First, the initial transfer of energy is intense as the sailplane moves towards the quasi-equilibrium state of the Ascent where the speed remains relatively constant. Right after the initial transfer, the sailplane actually gives back energy to the winch system (between time equals 1.0 and 2.0). You will see in the next graph of Wing Load Factor, that there is also evidence that the sailplane is helping recharge the winch system to get ready for the Bucket phase and this happens up to about time equals 2.1.
A second interesting point is that after the sailplane is free from the winch line at point D, you would expect the total energy to remain constant as kinetic energy (speed) is converted to potential energy (altitude). However, the total energy decays slightly right after release. It is likely that this is a loss of energy from drag induced by the high speed (125 mph). Drag is related to the square of the speed so the shape of the decay makes sense. Some of this drag was probably caused by the external instrumentation.
Wing Load Factor Graph
It was possible to measure wing deflection accurately from the wing video. It was a frame by frame process which was laborious. Wing deflection is proportional to the wing load or the lift force exerted by the wing. Trying to calibrate the information was not practical. Instead, we chose to plot the relative wing deflection as a wing load factor where the maximum load was set at 100%. This yields some valuable insights. Figure 7 shows the Wing Load Factor.
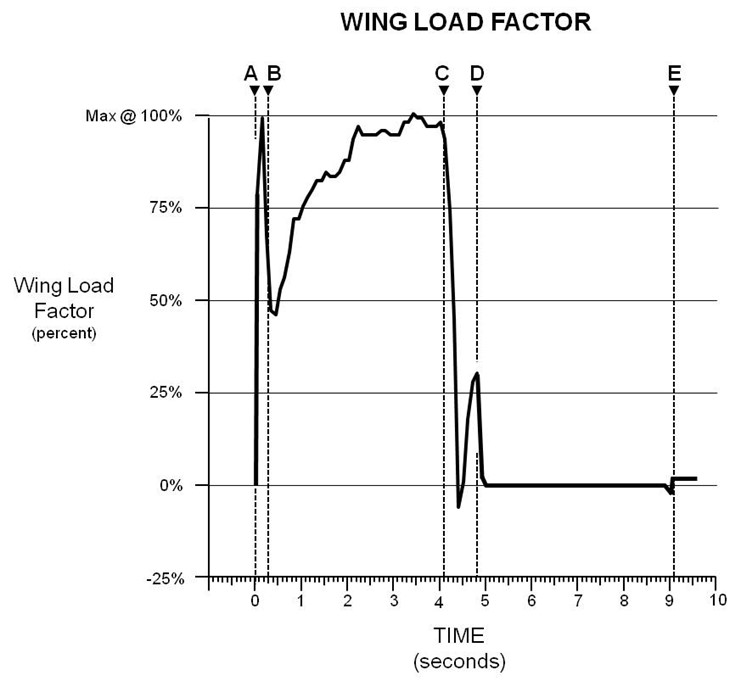
Figure 7. Wing Load Factor.
Again, you can see that the initial transfer of energy from the winch line to the sailplane generated a spike in the wing load after the throw as the sailplane established its new, quasi-equilibrium state during the Ascent. What this graph suggests is that the force generated by the winch line regained its maximum value at time equals 2.1. We hypothesized that at that point, if the Bucket was entered, the sailplane could have attained an altitude of 215 meters but only have been on the winch line for a total of 2.8 seconds. That would be worth potentially 2 extra points for the round which might be golden.
Another insight from a physics standpoint is that the energy extraction from the winch line has similarities to a hi-start launch. That being the case, the F3J launch behaves like back to back hi-start launches where the hi-start is recharged in between.
In Conclusion
As with any experimentation, you answer a lot of questions but you raise so many more new ones. The team members mulled over the details of the data and generated a lot of hypotheses to test. We are committed to do another series of tests after the first of the year. We are in the process of amending our instruments and methodology to do so.
A special thanks to my team mates Jody Miller, Ed Dumas, Gordon Buckland, and Jeff Duval for this insightful experiment.
